


This section of the QtWebKit Guide serves as an introduction to the HTML5 Canvas API features of QtWebKit.
The HTML5 Canvas API enables you to draw within a Web page or Web App using JavaScript. After you define a rectangle that serves as your drawing canvas, you can draw straight and curved lines, simple and complex shapes, graphs, and referenced graphic images. You can add text, color, shadows, gradients, and patterns. The canvas API also enables you to save or export the canvas as a .png or .jpeg image file.
To define the drawing area, set the width and height of a <canvas> element. For example, the following sets a drawing area with a height of 100 pixels and width of 200 pixels:
<canvas id="mycanvas" width="100" height="200"></canvas>
By default, canvas elements are sized 150 pixels high and 300 pixels wide. You can also set the size of the canvas using CSS:
canvas { height : 200px; width : 100px; }
The canvas element is transparent and has no visible borders until you access the 2D rendering context.
Resetting the width or height of an existing canvas erases its contents and resets all the context properties of the canvas to their default values.
The rendering context defines the methods and attributes needed to draw on the canvas. QtWebKit currently supports the two-dimensional rendering context. The following assigns the canvas rendering context to a context variable:
var context = canvas.getContext("2d")
The 2d context renders the canvas as a coordinate system whose origin (0,0) is at the top left corner, as shown in the figure below. Coordinates increase along the x axis from left to right and along the y axis from top to bottom of the canvas.
The 2D rendering context supports rectangles, lines, and arcs, which you can combine to build complex shapes and graphic images.
The rectangle is the only geometric shape that is built in to the canvas API. You can draw an outline of a rectangle, a filled rectangle, and a filled rectangle with clear parts. You do not have to create a path to draw a rectangle.
To draw an outline of a rectangle, use the strokeRect() method.
To draw a filled rectangle, use the fillRect() method. The default fill color is black.
To clear part of a filled rectangle, use the clearRect() method.
Each method accepts the following series of arguments:
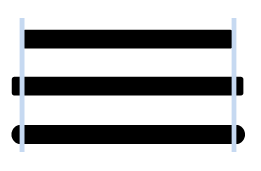
For example, the following code draws concentric rectangles:
     var context = canvas.getContext("2d");
     canvas.strokeRect(50,50,50,50);
     canvas.fillRect(60,60,30,30);
     canvas.clearRect(70,70,10,10);
To draw a line, you first have to "put your pencil down" on the canvas by creating a path. The context.beginPath() method sets a new path in the canvas. Each line that you draw is stored as a sub-path. Sub-paths can be closed to form a shape, or they can be left open. Each time you want to draw a new shape, you have to call the beginPath() method to reset the current path.
After calling beginPath(), you set your starting position on the canvas by calling the context.moveTo(x,y) method. The moveTo(x,y) method creates a new subpath on the canvas that begins at the Cartesian point (x,y).
To draw a straight line, call the context.lineTo(x,y) method. This adds the point (x,y) to the current subpath and connects it to the previous subpath by a straight line. In other words, (x,y) are the coordinates of the line's endpoint. For example:
     context.beginPath();
     context.moveTo(10,10);
     context.lineTo(30,30);
To get the pencil to actually draw on the canvas, first use the strokeStyle property to set the color to a value such as black (#000):
context.strokeStyle(#000);
(The strokeStyle property can be a CSS color, a pattern, or a gradient.) Then use the context.stroke() method to actually draw the line on the canvas:
context.stroke();
This produces the image below. The numeric coordinates are added for clarity but are not part of the image drawn by the code:
To create a shape, call the context.closePath() method:
     context.closePath();
     context.moveTo(10,10);        // starting point
     context.lineTo(30,30);        // specify first line
     context.moveTo(30,30);        // move to end of first line
     context.lineTo(60,10);        // specify second line
     context.moveTo(60,10);        // move to end of second line
     context.lineTo(10,10);        // specify third line to close triangle
     context.strokeStyle("#000");    // use black color for lines
     context.stroke();        // draws the triangle lines on the canvas
To fill the shape, use the fillstyle property and the fill() method:
     context.fillStyle("#FF0000"); // use red color for fill
     context.fill(); // fill the triangle
The commands, if coded fully, would create the shape below:
Note: It is not necessary to close the path when calling the fill() method. Calling fill() closes the path and creates the completed shape.
You can draw lines of various widths, endcap types, and joining options by configuring the following attributes:
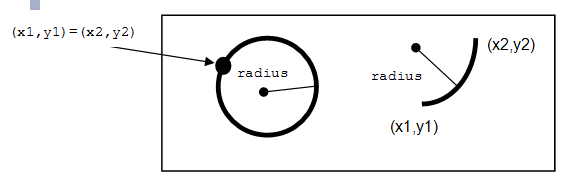
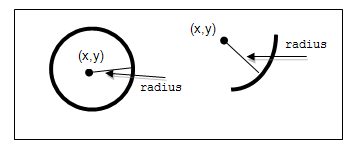
To draw an arc, you begin with the same steps your followed to create a line:
Both startAngle and endAngle are measured from the x axis in units of radians.
A complete circle is 360 degrees, or 2Π radians. A semicircle is 180 degrees, or Π radians. The number of radians is the number of degrees multiplied by Π/180, expressed in JavaScript as:
var radians = (Math.PI/180)*degrees;
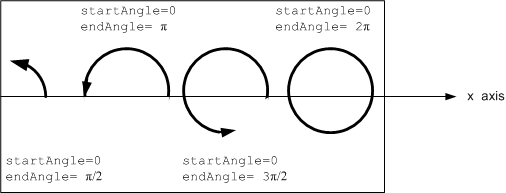
anticlockwise has the value TRUE for each arc in the figure above because they are all drawn in the counterclockwise direction.
context.strokeStyle = "#FF0000";
sets the fill color to red.
Note: It is not necessary to close the path if you are going to call the fill() method. The fill closes the path and creates the completed shape.
To create complex shapes, combine lines and arcs:
You can also create complex shapes by removing portions of the shapes you draw. The clip() method creates a clipping path that defines the area along which your "scissor" will cut. Any parts of the shape outside the clipping path are not displayed. To create a complex shape using the clip() method:
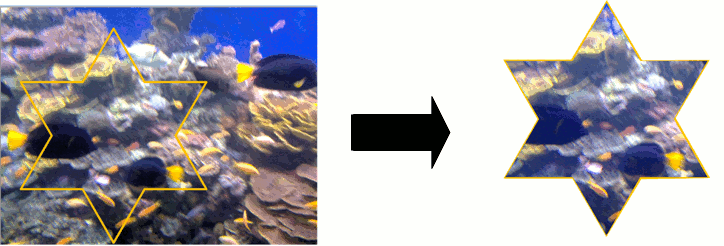
The new shape displays. The following shows how a clipping path can modify how an image displays:
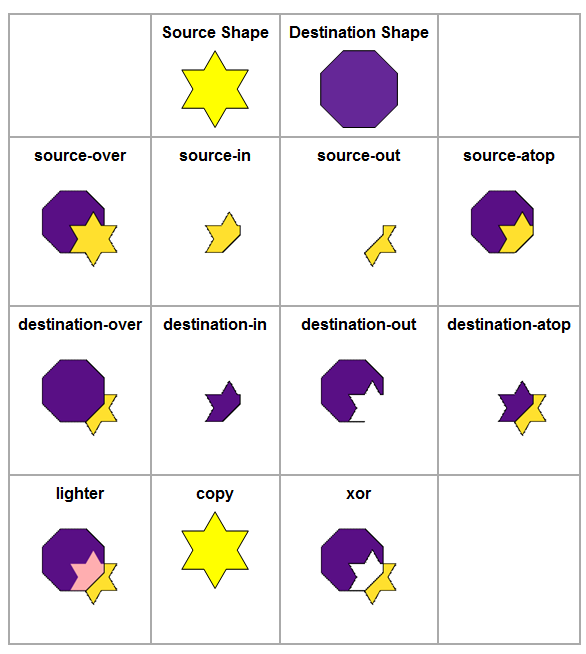
You can build complex shapes by drawing shapes on top of each other. It is also possible to draw shapes behind existing shapes and to mask parts of shapes by using compositing operations. The globalCompositeOperation attribute sets the way shapes can be combined.
The first shape drawn on the canvas to which additional shapes are added is called the destination shape. The shape drawn on the canvas afterwards to create the composite image is called the source shape. The value of the globalCompositeOperation attribute must be set to one of the following:
The following figure shows the various compositing effects:
You can save or export your canvas drawings as .png or .jpeg image files by calling the toDataURL() method:
canvas.toDataURL([type, ...])
where:
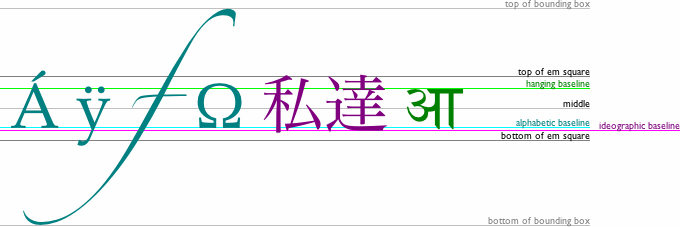
You can draw text on your canvas by setting the following font attributes on the 2d drawing context:
context.font = "12pt Arial";
The default value is 10px sans-serif.
If you set the font attribute to a relative font size, the browser multiplies it by the computed font size of the <canvas> element itself. For example:
context.font = "200%";
To draw text on a canvas:
context.font = "bold 11px arial"
TextMetrics measureText("Text to draw");
where TextMetrics is the object returned. Its width attribute is the width, in pixels, that the "Text to draw" would be when drawn with the font specified by the font attribute.
context.fillText("Text to draw",x,y,maximumWidth);
where x and y are the coordinates at which the drawing begins (the anchor point), and maximumWidth is the maximum width of the text string (optional). If the width returned in step 2 is larger than the maximumWidth, the font is scaled down until the width of the text string is less than the maximumWidth specified.
If you don't specify the font attribute, the text inherits the font size and style of the <canvas> element itself.
context.fillText("Text to stroke",x,y,maximumWidth);
You can insert existing images onto your canvas, you can scale or crop them, and you can combine them to create composite images. You can also draw new images by creating an Image() object with JavaScript.
To insert an existing image onto a canvas, call the drawImage method:
context.drawImage(image, dx, dy, dw, dh)
where:
 <canvas id="demo1" width="100" height="150"></canvas>

 var canvas = document.getElementById("demo1");
 var context = canvas.getContext("2d");
If dw and dh are not specified, the image retains its source dimensions when drawn on the canvas. When dw and dh are specified, the image is scaled to width dw and height dh when drawn on the canvas.
If you want to crop the source image, the drawImage method can be overloaded with the following arguments:
context.drawImage(image, sx, sy, sw, sh, dx, dy, dw, dh)
where:
Use this method if you want to crop the source image to the rectangle (sx, sy, sw, sh) before drawing it on the canvas. The destination image will have width dw, height dh, and upper left corner at coordinates (dx,dy) on the canvas.
To create a new image using JavaScript, create an Image object and define its source. Use an onload event handler to ensure that the drawImage method is not called until the image has finished loading. For example:
 var graphic = new Image();
 graphic.src = "clipart/graphic.png";
The image begins to load.
 graphic.onload = function(){
     context.drawImage(graphic,x,y);
 };
You can create patterns with an image by repeating it horizontally, vertically, or both. The top left corner of the first image must be anchored at the origin of the coordinate space. To repeat an image, call the createPattern method:
context.createPattern(image, repetition);
where:
         <canvas id="demo1" width="100" height="150"></canvas>

         var canvas = document.getElementById("demo1");
         var context = canvas.getContext("2d");
The repeated images are the same size as the source image. The createPattern method does not scale the images.
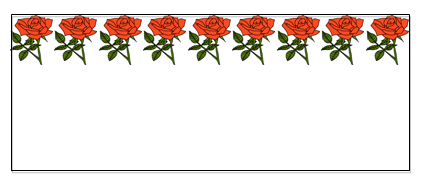
For example, to create a horizontal pattern of roses, create an Image object to use as a pattern and define its source. Use an onload event handler to ensure that the createPattern method is not called until the image has finished loading. For example:
     var roses = new Image();
     roses.src = "clipart/roses.jpg";
The image begins to load.
     roses.onload = function(){
         var pattern = context.createPattern(roses,repeat-x);
     };
To draw the outline of a shape in color, set the strokeStyle attribute to any valid CSS color value. The color value can be in hexadecimal notation or in RGB/HSL notation, as described in Specifying Color and Opacity. For example, either of the following sets a shape's outline to red:
 context.strokeStyle = "#FF0000"
 context.strokeStyle = "rgb(255,0,0)"
To fill a shape with color, set the fillStyle attribute to a l{CSS Color Value}{CSS color value}. The color value can be in hexadecimal notation or in RGB/HSL notation. For example, either of the following colors a shape's interior as blue:
 context.fillStyle = "#0000FF"
 context.fillStyle = "rgb(0,0,255)"
The CSS3 Color Module specification extends both RGB and HSL color models to include a color's opacity, referred to as its alpha. These extended models are known as RGBA and HSLA. There are no hexadecimal notations for RGBA and HSLA values. The following specifies varying levels of opacity for a blue shape:
 context.fillStyle = rgba(0, 0, 255, 0)        // transparent
 context.fillStyle = rgba(0, 0, 255, 0.5)    // semi-transparent
 context.fillStyle = rgba(0, 0, 255, 1)        // opaque
When you set the context.strokeStyle or context.fillStyle attributes, whatever value you set becomes the default value for all subsequently drawn shapes, until you set a new value.
A gradient is a smooth transition between colors. There are two types of gradients: linear and radial.
A linear gradient transitions the color along a line between two points. To create a linear gradient, call the createLinearGradient method:
createLinearGradient(x0, y0, x1, y1)
where (x0, y0) is the starting point and (x1, y1) is the ending point for the linear gradient.
A radial gradient transitions the color along a cone between two circles. To create a radial gradient, call the createRadialGradient method:
createRadialGradient(x0, y0, r0, x1, y1, r1)
where:
Gradients must have two or more color stops, representing color shifts positioned from 0 to 1 between to the gradient's starting and end points or circles:
addColorStop(position,color)
where:
For example, to define a gradient that varies from red to blue horizontally along a rectangular area:
var redbluegradient = context.createLinearGradient(0,0,100,0);
         redbluegradient.addColorStop(0, "rgb(255,0,0)"); // red at the left side of the rectangle
         redbluegradient.addColorStop(1, "rgb(0,0,255)"); // blue at the right side of the rectangle
         context.fillStyle = redbluegradient;
         context.fillRect(0,0,100,150);
To define a gradient that varies from red to blue vertically along a rectangle:
var redbluegradient = context.createLinearGradient(0,0,0,150);
     redbluegradient.addColorStop(0, "rgb(255,0,0)"); // red at the top of the rectangle
     redbluegradient.addColorStop(1, "rgb(0,0,255)"); // blue at the bottom of the rectangle
     context.fillStyle = redbluegradient;
     context.fillRect(0,0,100,150);
Note: A canvas gradient's color stops behave slightly differently than those used within non-canvas gradients. Webkit gradients specify mandatory from and to colors, with optional color-stop values for additional color shifts within the overall range of the gradient. For canvas gradients, even the initial and final colors are defined as color stops.
To add a shadow effect to a drawing on a canvas, set the following attributes:
The following example code adds a semi-transparent black shadow to the bottom right of a blue rectangle:
     var context        = canvas.getContext("2d");
     context.shadowOffsetX    = 5;
     context.shadowOffsetY    = 5;
     context.shadowBlur    = 10;
     context.shadowColor    = "rgba(0,0,0,0.5)";
     context.fillStyle    = "#0000FF";
     context.fillRect    = (0,0,100,50)
When drawing shapes and paths, you can translate the canvas's origin, rotate the canvas around the origin, scale the units in the canvas grid, and modify the transformation matrix directly.
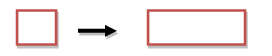
Translating the origin enables you to draw patterns of different objects on the canvas without having to measure the coordinates manually for each shape. To translate the origin of the canvas, use the translate method:
context.translate(x,y);
where:
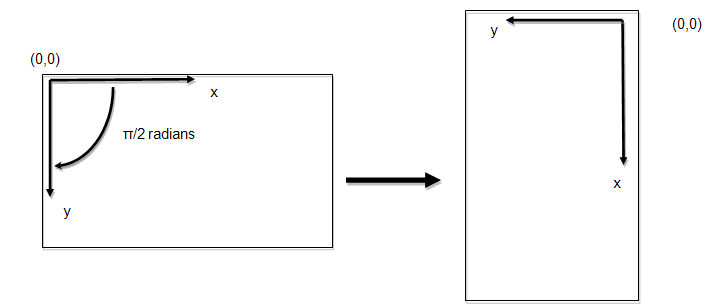
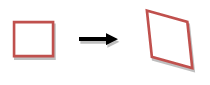
To rotate the canvas around the current origin, call the rotate() method:
context.rotate(angle);
where angle is the clockwise rotation angle in radians. The number of radians is the number of degrees multiplied by Π/180, expressed in JavaScript as:
var radians = (Math.PI/180)*degrees;
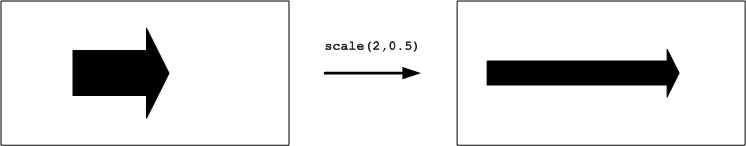
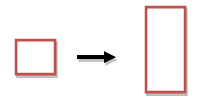
To increase or decrease the size of each unit in the canvas grid, call the scale method:
context.scale(x,y);
where:
The scale factors are in multiples. For example, scale(2.0, 0.5) would double the horizontal size of an object drawn on the canvas and half its vertical size, as shown below:
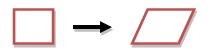
Modifying the transformation matrix directly enables you to perform scaling, rotating, and translating transformations in a single step.
The transformation matrix is an affine transformation matrix from linear algebra. Affine transformations preserve colinearity and relative distance in the transformed coordinate space. This means that points in a line remain in a line, parallel lines remain parallel, and the distance between lines and objects maintains the same ratio, even if a scale factor is applied. Repositioning by translation, rotation, or skewing is also possible.
Each point on the canvas is multiplied by the matrix before anything is drawn. The HTML5 Canvas API defines the transformation matrix as:

where:
![]()
![]()
The scale factors and skew factors are multiples; e and f are coordinate space units, just like the units in the translate(x,y) method.
The rotation transformation matrix is as follows:
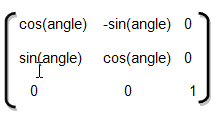
where the angle of rotation is in radians.
See Also: senocular.com for a good explanation of how transformation matrices are used identically within Adobe Flash.
You can animate a canvas drawing by repeatedly redrawing the canvas for each frame and translating, rotating, skewing, and scaling the drawn objects.
To draw each frame by employing the HTML5 canvas API, you should define the original canvas state and save it for future reference. The drawing context maintains a stack of drawing states. Each state consists of the current transformation matrix, current clipping region, and current values of the following attributes:
The current path and the current bitmap are NOT part of the drawing state. The path can be reset only by invoking the beginPath() method. The current bitmap is a property of the canvas, not of the context.
To save the original canvas state, call the save() method:
context.save();
Before drawing each new frame, you must clear the canvas:
canvas.clearRect(x,y,width,height);
where:
Draw the new frame using any of the methods provided by the canvas API. Then save it by calling the save() method.
If you wish to return to the state of the original frame as the basis for each new frame that you draw, call the context.restore() method.
To execute the drawing methods repeatedly, use the standard JavaScript-based animation technique, calling the setInterval() and clearInterval() methods. The following shows how to execute an animation function every 50 milliseconds (corresponding to 20 times per second, a typical animation frame rate), then subsequently halt the animation:
 var id = setInterval(functionName, 50);
 clearInterval(id);
See Also: