


Using sp-memusage
The sp-memusage tool is a collection of memory usage monitoring tools and scripts. The following tools are recommended for testing the performance of your application:
- mem-cpu-monitor shows both CPU and RAM usage for the whole system and requested processes at selected intervals, one line for each report. In addition, it can show the memory usage of process control groups. This tool can be used with the Instrumentation Dashboard.
- mem-smaps-private shows how much of the memory used by the processes is private, shared, clean or dirty and what is the given processes' current share (proportional set size) of the whole device memory usage.
You can also use the following tools and scripts included in the sp-memusage tool set:
- mem-dirty-code-pages lists incorrectly compiled shared libraries and how much memory is lost because the code is not fully shareable.
- mallinfo.so LD_PRELOAD library outputs glibc allocator statistics either at given intervals or when receiving SIGUSR1. This can be used to track the fragmentation of the process memory. This means the difference between the allocated memory estimated by the program and the actually allocated memory.
- run-with-mallinfo is a convenience script for using mallinfo.so.
- run-with-memusage is a convenience script for using the memusage.so debug library provided by glibc. Memusage collects statistics about application memory management during its runtime and reports them after the application exits.
- Note: The application needs to exit normally or gathering of statistics fails.
Packages
source: sp-memusage
binary: sp-memusage, sp-memusage-dbg
Installing sp-memusage on the Harmattan device
Install sp-memusage through the developer mode applet.
Prerequisite: Developer mode must be enabled.
- Select Settings > Security > Developer mode.
- Install the Networking bundle package by clicking Install.
- You get a notification screen that lists all the applications to be installed in the bundle package. To install, click OK.
- A dependency notice appears. Click Accept.
For more information on developer mode and installable tools, see Activating developer mode.
Using the mem-cpu-monitor tool with the Instrumentation Dashboard
Instrumentation Dashboard is an extension to Qt Creator that provides data gathering and visualisation features.
Precondition:
Instrumentation Dashboard has been installed and connected to the Harmattan device. For instructions, see Using Instrumentation Dashboard.
The tool mem-cpu-monitor is a lightweight tool for monitoring the status of your Harmattan device and optionally the status of some processes. Device statistics are provided by default and shown in the system view window. The system view contains the following information:
- Time ([hh]:[mm]:[ss] in GMT)
- Memory used
- Memory changed
- CPU%
- CPU MHz
In addition to the above, CPU utilization and CPU History is also shown in a graphical view.
Tool settings
To open the settings window, click the Settings button ![]() in the tool bar. You can edit the following inputs to the tool:
in the tool bar. You can edit the following inputs to the tool:
- Interval: If you want to change the data acquisition time, click on spin box up and down arrow to the desired value. The default interval value is 3 seconds.
- System Threshold Values: If you want the output only when the CPU usage and memory change is greater than a specified threshold value, you can set the threshold for System by clicking CPU Usage and Memory Change.
- Process Threshold Values: If you want the output only when the CPU usage and memory change is greater than a specified threshold value, you can set the threshold for Process values by clicking CPU Usage and Memory Change.
Monitoring processes
When monitoring processes, you can specify the target processes either by giving their names or their process identifiers in their corresponding edit boxes.
To start the tool, click Tools in the Instrumentation Dashboard top menu bar and select mem-cpu-monitor.
Process names
To monitor processes names, follow these steps:
- Click Select Target App button in tool bar.
- Click on radio button Process Name and enter the names of processes you wish to monitor, with each name separated from the other by a semi-colon (;).
-
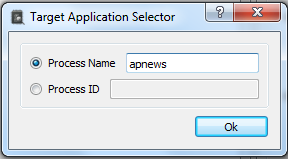 Target Application Selector
 - Note: Even if you do not specify a process name or PID in the target selector window, the tool still shows System View and System View CPU graph of the device.
-
- Click Ok.
- The tool displays the monitoring data for all the running instances of the process names mentioned in the edit box following the Process Name radio button.
-
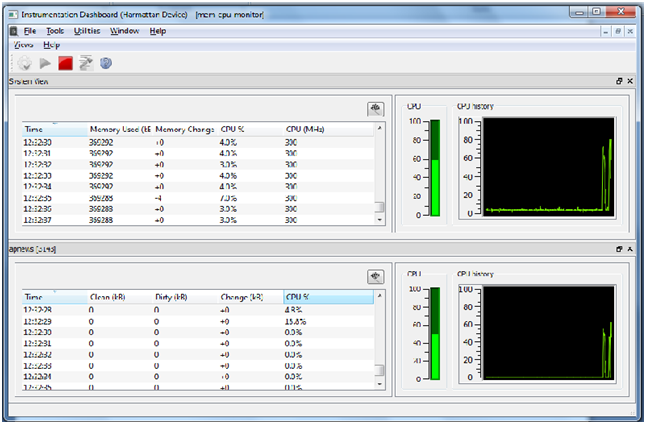 mem-cpu-monitor visualisation
- After you have collected the required data, click Stop.
Every process window is named as the process name followed by its PID in square brackets ([]). Information about each process is shown in a separate tab containing both the statistic and the graphical view. The Statistic view contains the following information:
- Time: Time Stamp
- Clean: clean memory (Assumed to be easily freeable)
- Dirty: dirty memory (might need writing to disk or swap. Takes more work to free)
- Change: Memory change
- CPU%: percentage of Change in CPU utilization
As in the case of system view, the process view contains the graphical representation of CPU utilization and CPU utilization history. For more information on "clean" and "dirty" memory types, see Paging in Wikipedia.
Process identifiers
To monitor processes identifiers, follow these steps:
- Click Select Target App button in tool bar.
- Click on radio button Process ID, and enter the PIDs of processes you wish to monitor with each PID is separated from the other by a semi-colon (;).
- Click Ok.
The tool displays the monitoring data for all the running instances of the process names mentioned in the edit box follow-ing the Process ID radio button.
The following table presents the button elements in the example figure.
| Element in the example figure | Description |
|---|---|
|
|
Opens the Target Application Selector window. The button is disabled if an application is running. |
|
|
Start button starts the data collecting. The CPU and memory information is displayed in:
|
|
|
Stop button stops the data collecting. |
|
|
Settings button launches the mem-cpu-monitor settings window. |
|
|
Help button launches the tool help. |
|
|
Generate Summary Report and Save button generates the summary based on system/process view output and saves it on a persistent file system. |
Using the tool on the Harmattan device
Note: For a comprehensive list of the available commands, see the man pages for each tool.
The mem-cpu-monitor tool displays the following output:
# mem-cpu-monitor -i 1 $(pidof pulseaudio)

System total memory: 490628 kB RAM, 467196 kB swap
________ __________________ ___________ _______________________________
        |  system memory   |system CPU |PID 1443 pulseaudio --system ->
   time:|     used: change:|   -%: MHz:|  clean:  dirty: change: CPU-%:
18:10:46     289100      +0 100.0% 1000      508    2344      +0   0.0%
18:10:47     289132     +32  26.7% 1000      508    2344      +0   0.0%
18:10:48     289132      +0  17.2% 1000      508    2344      +0   0.0%
18:10:49     289172     +40  62.0% 1000      508    2344      +0   0.0%
18:10:50     277064  -12108  71.7% 1000      508    2344      +0   0.0%
18:10:51     277064      +0   2.0% 1000      508    2344      +0   0.0%
18:10:52     277056      -8   5.0% 1000      508    2344      +0   0.0%
The above example output shows the PulseAudio and system process information at one-second intervals.
For more information and usage examples on mem-cpu-monitor, enter the following command:
mem-cpu-monitor -h